MetGIS PRO+
Discover MetGIS Pro+: The revolutionary weather dashboard

MetGIS Pro+ is an out-of-the-box weather dashboard that covers the requirements for high-quality weather data for a wide range of industries. This interactive graphical user interface, which now also includes 3D visualization, is a further development of our proven MetGIS Pro product. It bundles a wealth of information, provides a central portal for all weather data and thus enables better decision-making in all weather-related issues.
Our product provides high-resolution, fully zoomable weather forecast maps for your target regions. In addition, you can choose any point on the maps to view detailed forecast tables for the next 10 days. The forecasts are available around the clock, are password protected and can be accessed online via a web browser. We have made every effort to ensure that the system is very easy and intuitive to use, especially for people who are not weather experts.
 Our innovation: Interactive weather dashboard, including 3D visualization!
 Ultra-precise weather data with a resolution of up to 30 m
![]() Combines area-based, zoomable forecasts with point forecasts
Combines area-based, zoomable forecasts with point forecasts
![]() Ready-to-use: Available online 24/7 via web browser
Ready-to-use: Available online 24/7 via web browser
 Available for worldwide locations, even for remote regions
 Customization to meet user requirements
The MetGIS Pro+ weather dashboard combines many advantages in one easy-to-use application. No programming skills needed!
MetGIS Pro+ allows you to visualize the data from our weather APIs easily and without technical expertise. All information is presented graphically so that you can use MetGIS’ extensive expertise and experience in an intuitive user interface. MetGIS Pro+ is your comprehensive, ready-to-use solution for weather data – simple, efficient and effective.


A picture is worth a thousand words – and our interactive demonstration illustrates the advantages of MetGIS Pro+.
Test the dashboard for selected regions and gain comprehensive insight into the functionality of this product.

Temperature
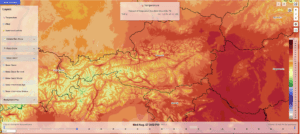
The MetGIS temperature maps show the predicted air temperature at 2 m above the ground, in degrees Celsius (°C) or Fahrenheit (°F). These maps have a particularly detailled structure due to their adaptation to the high-resolution terrain.
Wind
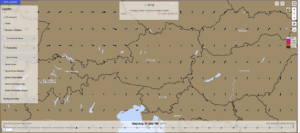
The wind data includes both the speed and the direction of the wind and refers to a height of 10 m above the ground. The wind is given in meters per second (m/s), kilometers per hour (km/h), miles per hour (mph) or knots (kn). As our high-resolution terrain models are also used to calculate wind parameters, in mountainous areas our wind maps may show substational variations even on small areas.
Sunshine duration
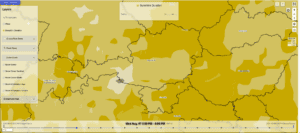
This variable specifies the duration of sunshine for three-hour time intervals. There are various limits to the exact prediction of the duration of sunshine, such as the shading caused by steep terrain or the handling of sunrays that are barely visible through thin, high-altitude clouds.
Clouds, rain and snow
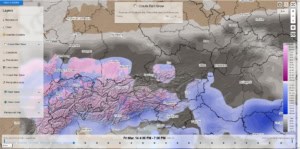
Clouds Rain Snow: Combined weather map showing at a glance the areas where there is cloud cover and where it is raining or snowing. The cloud cover is given as a percentage of the sky coverage. Amounts of rain (unit mm or in) and amounts of fresh snow (unit cm or in) refer to three-hour intervals. Rain here also includes sleet without the formation of snow cover.
Cloud cover: Indicates what percentage of the sky is covered with clouds. The value range is 0 to 100 %. 0 % stands for cloudless weather, 100 % for a completely overcast sky. 75 % cloud cover means, for example, that three quarters of the sky is covered with clouds.
Precipitation: Amount of precipitation that has fallen in three-hour intervals, in millimeters (mm) or inches (in). In the case of rain, this is simply the amount of rainwater, and in the case of snowfall, the water that would remain after the fallen snow has melted. The unit mm is identical to the unit liters per square meter (l/m2). This means that a precipitation amount of 10 mm means that 10 liters of water have fallen per square meter.
Fresh snow: Amount of fresh snow for three-hour intervals, in centimeters (cm) or inches (in). The areas of fresh snow appear particularly highly structured on the maps due to the adaptation to the high-resolution terrain.
Precipitation radar: The precipitation radar maps provide a real-time display of the current precipitation. In contrast to most other weather variables, no forecast is provided, but values measured by precipitation radar stations are presented, some of which have been post-processed and edited.
Fresh snow
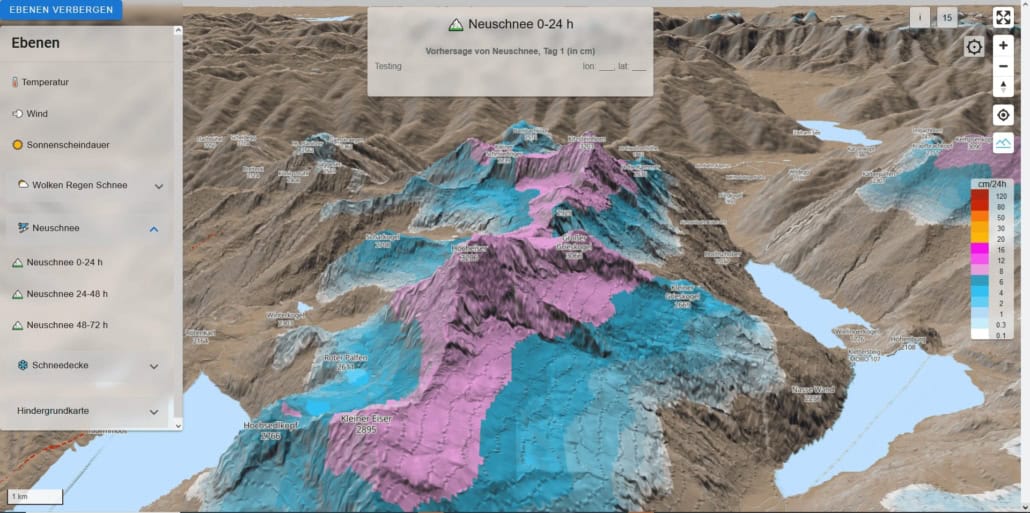
Fresh snow 0-24 h, Fresh snow 24-48 h, Fresh snow 48-72 h: These are maps showing fresh snow sums for 24-hour intervals, namely for the next 24 hours, as well as for the intervals 24-48 hours and 48-72 hours from now. The unit used is centimeters (cm) or inches (in).
Snow cover
Snow cover: This snow cover master map shows which areas are currently covered by snow. However, it is not possible to tell from this map how thick the snow cover is (snow depth). The map is created using data from various satellites (Sentinel, MODIS) and MetGIS internal model calculations and provides the best snow cover information that MetGIS has to offer. The horizontal resolution of the snow cover map is up to 30 meters.
Age of snow information: Indicates when the information on the snow cover map was last updated. This depends on the exact flight plans of the satellites and the cloud cover conditions and can vary from area to area.
Source of snow information: Indicates where the information on the snow cover map comes from. Depending on the geographical region and weather conditions, the sources of information are either satellites (Sentinel, MODIS) or weather simulation models from MetGIS.
Background map
You may choose between different background maps. Default are MetGIS maps which are based on OpenStreetMap.
Current weather
Current air temperature, felt temperature, wind speed and direction, cloud cover, and intensity of rain and snowfall
Temperature
Forecast of minimum and maximum air temperature, temperature distribution over the day in one-hour intervals
Precipitation
Forecast of rain and fresh snow (both daily totals and hourly totals), probability of precipitation
Wind
Forecast of wind speed and wind direction (daily and hourly values)
Sun
Time of sunrise and sunset, forecast of sunshine duration (daily and hourly)
Humidity
Forecast of relative humidity (daily average and hourly values)

 Time
Time
Temporal resolution: The temporal resolution (prediction interval) of the forecasts is:
– Forecast maps: usually three hours.
– Fresh snow maps are also available as 24-hour totals for today, tomorrow and the day after tomorrow.
– Point forecast tables: one hour or one day.
Forecast updates: We update our forecasts at least twice a day. Point forecasts are even recalculated four times a day.
Forecast range: Each forecast covers the next three days (maps) or the next 10 days (point forecast tables).
 Space
Space
Spatial resolution: Currently, the resolution of the weather maps over Central Europe, the Pyrenees and parts of South America is less than 100 m, the rest of the world 1 km. We can quickly set up additional extra-high resolution forecast regions for you.
3D visualization: Our 3D map mode is an absolute novelty in the field of operational weather forecasts visualization and offers an attractive plastic representation of the weather, with exciting navigation options.
Geographical background information: By default, we use a database based on OpenStreetMap as the background for our weather maps.
We are also happy to integrate customer-specific geographical information (special waypoints, roads, routes, etc.) into your specific version of MetGIS Pro+, if desired.
By selecting any location on the MetGIS Pro+ maps, the weather forecast for this location (e.g. city districts, mountain peaks, etc.) for the next 10 days is displayed in the form of point forecast tables containing both numerical values and weather symbols. The forecasts are available in daily or hourly resolution. The time series contain all relevant forecast parameters.


 Snow and avalanches
For ski resorts, slope management, avalanche warning services and anyone involved with snow and mountains.
MetGIS Pro+ is a great help, especially for weather monitoring over larger ski resorts or the respective focus region of avalanche warning services.
![]() Mining
Mining
For open-pit mines, it is essential to have a comprehensive understanding of the weather conditions in the mining area and its surroundings, including transport routes. Weather-related disruptions, such as storms, heavy snowfall or torrential rain, must be identified in a timely manner to ensure the implementation of appropriate counter measures.
![]() Traffic
Traffic
MetGIS Pro+ is an invaluable tool for traffic control centers that monitor weather conditions across vast regions. It enables these centers to respond swiftly to potentially hazardous weather situations. This feature is particularly beneficial for road maintenance services.
 More
More
MetGIS Pro+ is a valuable asset for a variety of sectors, including energy, agriculture, tourism and retail. The product is particularly beneficial for applications that require a comprehensive weather overview over a large area, while minimizing the need for extensive in-house visualization system development.
Do you have questions about our services or any other questions, simply fill out the contact form or send us an e-mail.
We also look forward to your call.

Meteorologe, Entwickler des Designs des MetGIS Prognosesystems
Curriculum vitae
This will close in 0 seconds
This will close in 0 seconds